Hi folks. I’ve had a lot going on since the last time I posted a daily chart blog. Some of you TSP’ers out there know me personally and some of you out there I’ve never met. In less than 30 days I will be retiring from my job as an Air Traffic Controller after almost 31 years. Will I miss it? Yea sort of. It is a cool job and one not everyone can do or wants to do. I will miss those that I worked with, the banter we had, and the pride in my work. But here is the reason for this information. I will continue to post and report on my moves in retirement. I will practice what I preached at work since 2008-2009, that last crash, and use what I’ve learned to run my account until I mentally have to hand it off to someone else. I’ve learned enough using my monthly moves to be comfortable moving my money no matter the situation. At this point of ones life, all advisories tell you, you should scale back and invest more conservatively. If you do not believe me, select the L2050 on the TSP site and then hit the play button. By the time you get to year 2050, you’ll be invested in 74% G and 6% bonds. That’s extremly conservative. So let’s look at my situation, I should be invested in the L2020. Look below and you will see where I should be invested according to the smart people.
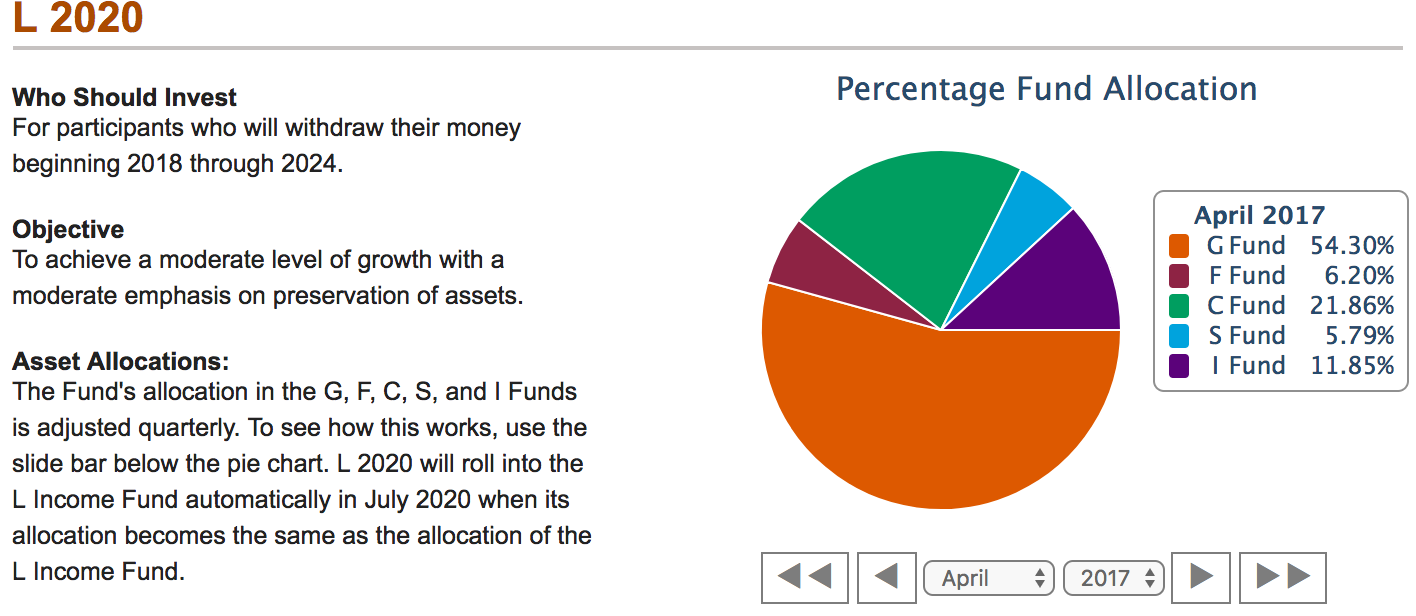
As you can see, I should invest at least 60% of my money in conservative low earning funds. At the end of June, the smart money once again would say that I should move my money into the L-income fund. That’s what it’s all about. Earn and invest while you’re working and then just put it on cruise control when you retire. So what is the L-income show investment strategy?

So according to the smart money managers, I should roll 80% of my money into the G and F funds. The G-fund is returning 2.02% a year and the F-fund the last year has returned 1.86%. Well, it doesn’t take a rocket scientist to figure out that it doesn’t keep up with inflation. Also you should google the 4% rule. If I’m doing my math right, and I’ve been wrong a lot in my life, if I draw down 4%, I will need a yearly return close to 7% to keep up with the draw down. So, I want and will be a little more aggressive than that using my monthly moves. My current setup is what I will take into retirement July 1st and it will stay that way until there is a monthly change. It is now time to practice what I preached. This my setup picture that is inside my TSP account.

If I showed a money manager this setup at my age and situation, they might just pass out. This is my last piece of advise to you younger TSP’ers. Learn to move your money in and out of funds now using unemotional, no news, no rumors, and no pressure from your peers so as to be as mechanical as a car engine. If you can move little money and look at your percentages instead of dollar amounts, then when your account grows over a half million or more, you will not be scared to make the moves. Wow, this really turned out to be a lot more long winded than I entended, but hopefully it will shed a little light on the future. I will also do my best to blog about my retirement and the TSP and it’s function so you will also know what to expect in the real world. Now to those charts.
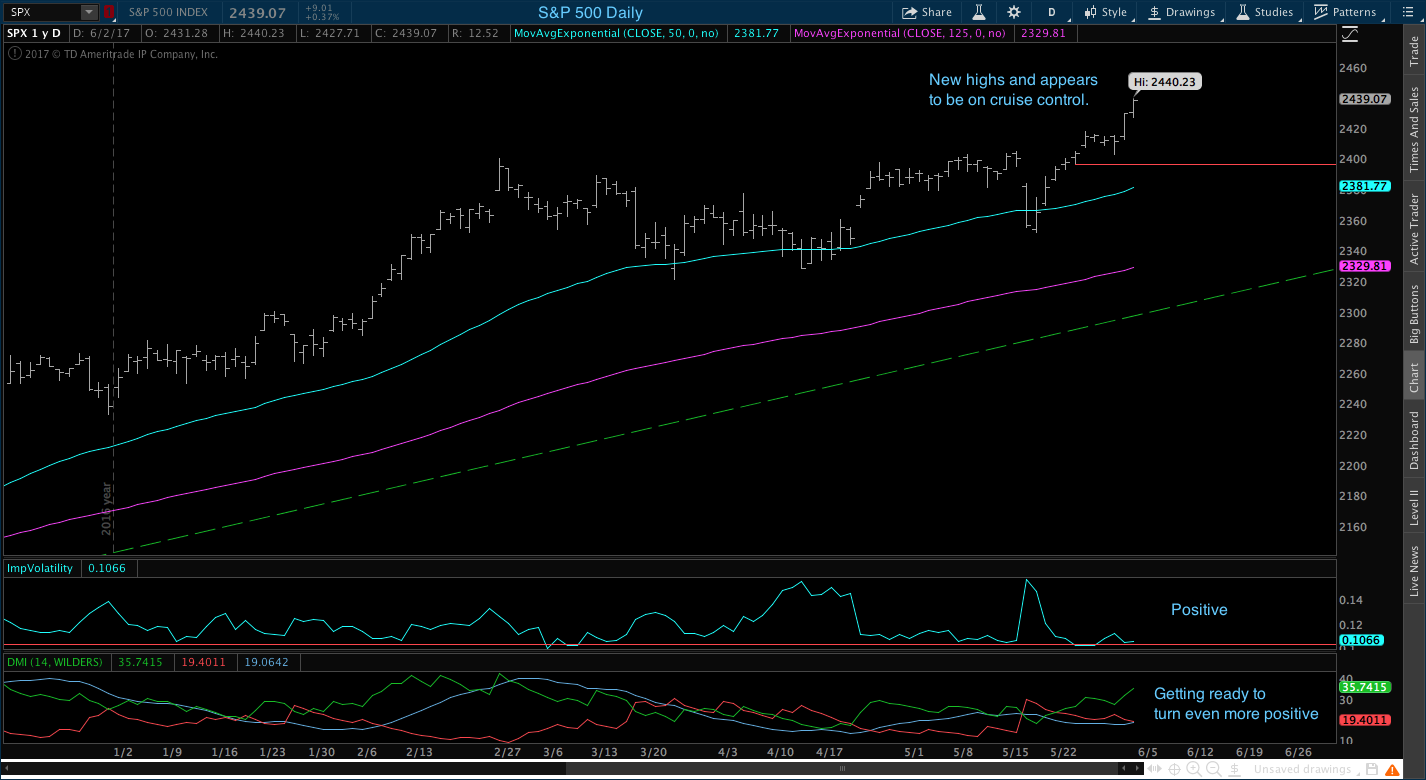
There is nothing to like about the S&P 500 daily chart. DMI and volatility are both positive. Price is breaking out to new all time highs. Like I marked on the chart, it appears to be on cruise control. We just ride the wave.


The Small Cap has not done a lot for weeks. It has basically been in a sideways slide. But looking at the orange line which is the upper part of a wedge, price broke out. We also got a higher pivot low which helps you draw and anticipate and uptrend. DMI is also turn positive, so now maybe the Small Cap will run. We are also going to ride with this one.


The International is just rolling. It would have been awesome to be invested here 100% since the first of the year, but that’s what we call being greedy and not smart. Everything here is positive and we will just ride the wave.


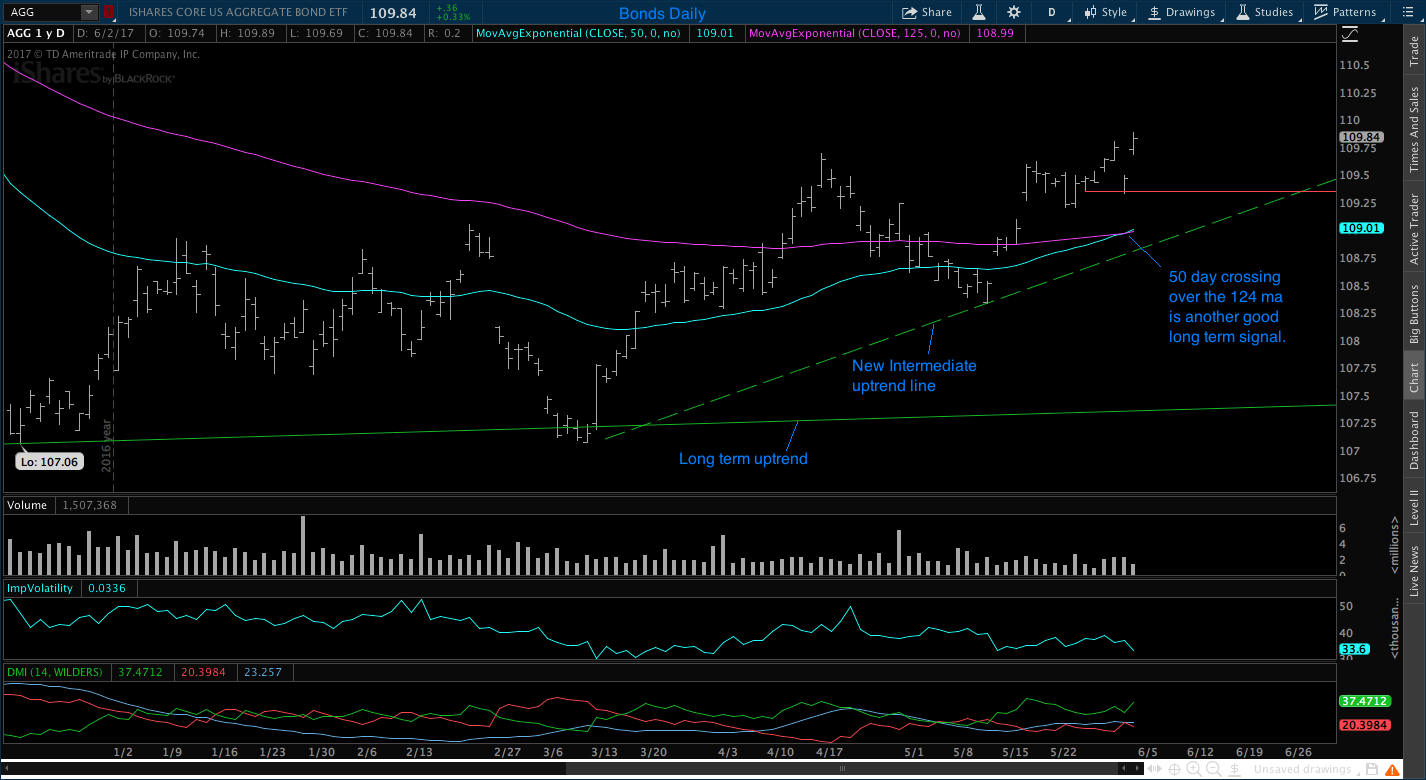
Bonds fired a weekly and a monthly buy signal this week. The daily buy signal was fired a few weeks back. This could be a sign that stocks will slow down and begin to consolidate or even pullback. Do not expect bonds to pay out big returns, but do expect a slow gradual gain if all these signals are correct. In order for bonds to reach their all time highs, it must continue this trend uphill for another 3%. That’s not a big payout, but it’s a safe payout. If the stock market slows or tanks, bonds will lesson the blow. Looking at the otherside, if stocks continue to rally, bonds should not hurt our setup. Monthly wants us in, so I am in. Below is the weekly chart showing the buy signal.


Conclusion: It’s been a very long time since every index we follow here has been a buy on all three charts. Volatility appears to be low and if it will stay that way throughout the summer months, maybe we can squeeze out a small gain and be happy. Right now, all is smooth sailing.
No comments:
Post a Comment