On the Retirement front this week not much to report, but I can see by logging into Employee Express that my annual leave payout will be made this week. So we will call that 6-7 weeks after retirement date. Also looks like they took out Medicare, Federal, State, and SS. All total for me I got about 67% of the total amount and the rest to taxes. Yes, your annual leave payout does count as YTD income. I am all zero’ed out now, so no more pay for me except retirement annuity checks. In case I didn’t mention it, I chose not to withdrawl any funds from my TSP, so it will be annutiy plus stipend until I feel the urge.

The S&P 500 fired sell warning 1 on Thursday and then sell warning 2 on Friday. We are due a good 5% pullback but this just looks like a little news drama to me. No way anyone can predict when these things will happen, but what I always hope is that they are gradual and the monthly moves will get us out for the moves that are more than 5% . Some of the people here that follow my moves did not live through the 50% drop in 2000 and the 57% drop in 2008, and the monthly got out in a very timely manner in both cases. This is what we protect against. These small moves like last week make the skittish make moves to early and then when prices snap back uphill, they miss that move. I took a longer view picture of the S&P 500 above and you are looking at the Year to date data. If you have been following the monthly moves since the beginning of 2017 and you just rode last weeks move down 1.7%, does it really hurt? None of us want to give back a dime but you have to be relistic. Nothing goes up forever and there will always be moments of ups and downs. Just this year alone, there has been 3 minor pull backs and one that dragged out for about 2 months. So don’t panic yet. Let it ride till the end of the month.


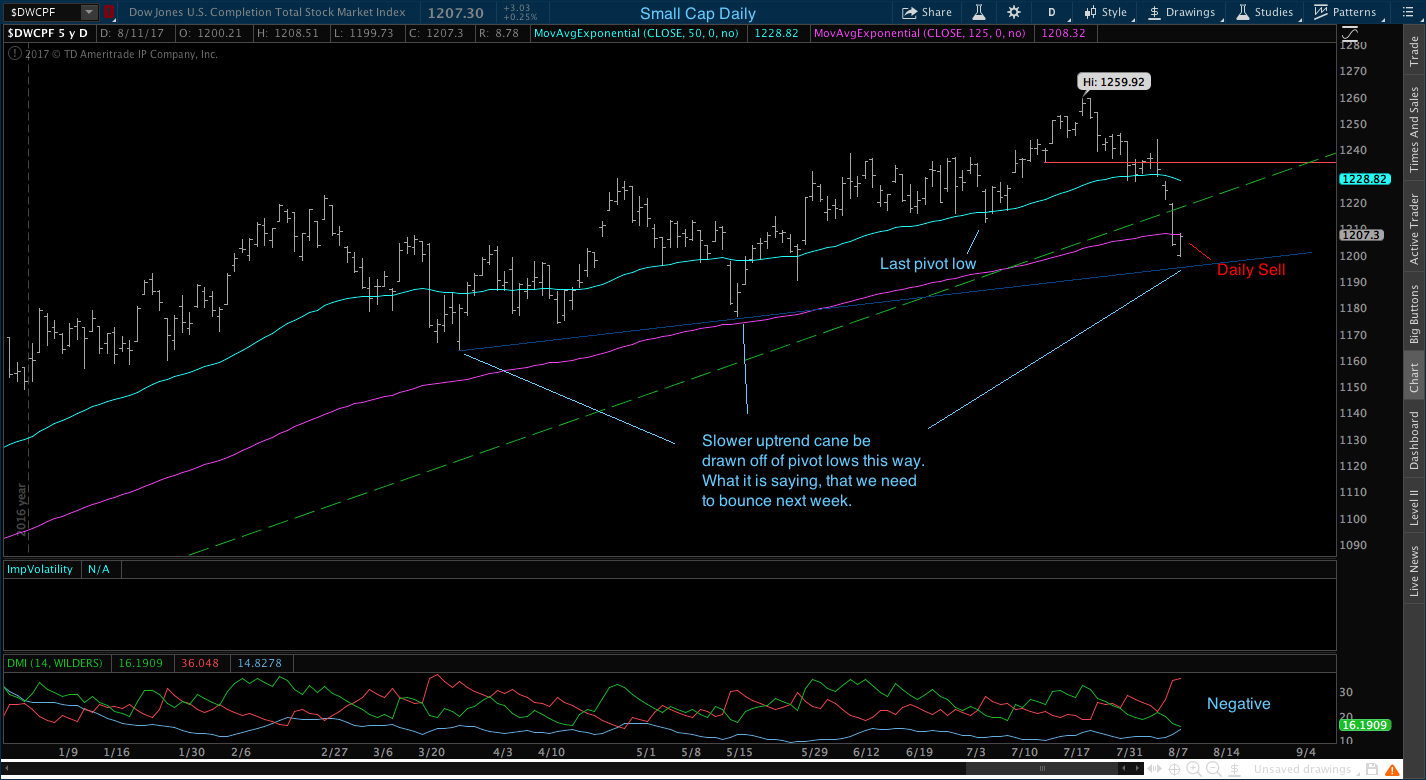
There is lots to say about the Small Cap daily above. The Small cap started it’s pullback a week before last weeks drama and may be leading us lower. If you look above at the last 4 white marks, price bars, they accelerated down compared to the prior week. This concerns me a little because it might mean that this may not be news led move down and that the Small Cap is telling us this is a major profit taking move is here. We are due. I’ve been riding this current uptrend since April 2016 and since March 2016 in the C-fund.
Sell warning 1 was fired last week. Sell warning 2 was fired Wednesday. An outright sell signal on Thursday and Friday the sell signal was confirmed on the daily chart. What are the importance of pivot lows? Pivot lows are point on a chart that show support and reversals that show prices moving up. When price do begin to fall, you hope that the last pivot low holds as support and price will not go below that point. Unfortunately last week that did not hold true for the Small Cap. I drew a new support line that can be used next week to see if it holds in dark blue. It is drawn using the last 2 major pivot lows. As you can see, we are there. That needs to hold or we are heading down to the next pivot low. I will be watching the Small Cap closely next week because no matter which direction it goes, it is likely the leader of the market.


I am sure that the International just followed the lead of the Small Cap and S&P last week, but I was disappointed to see price fall below the $67.21 level. Price had fought hard to get above that level and the bull flag breakout was suppose to take us to the $71.39 level. Sell warning 1 & 2 were fired last week. Volatility and DMI both turned negative. A reversal back uphill would be nice right at this point, but only time will tell.


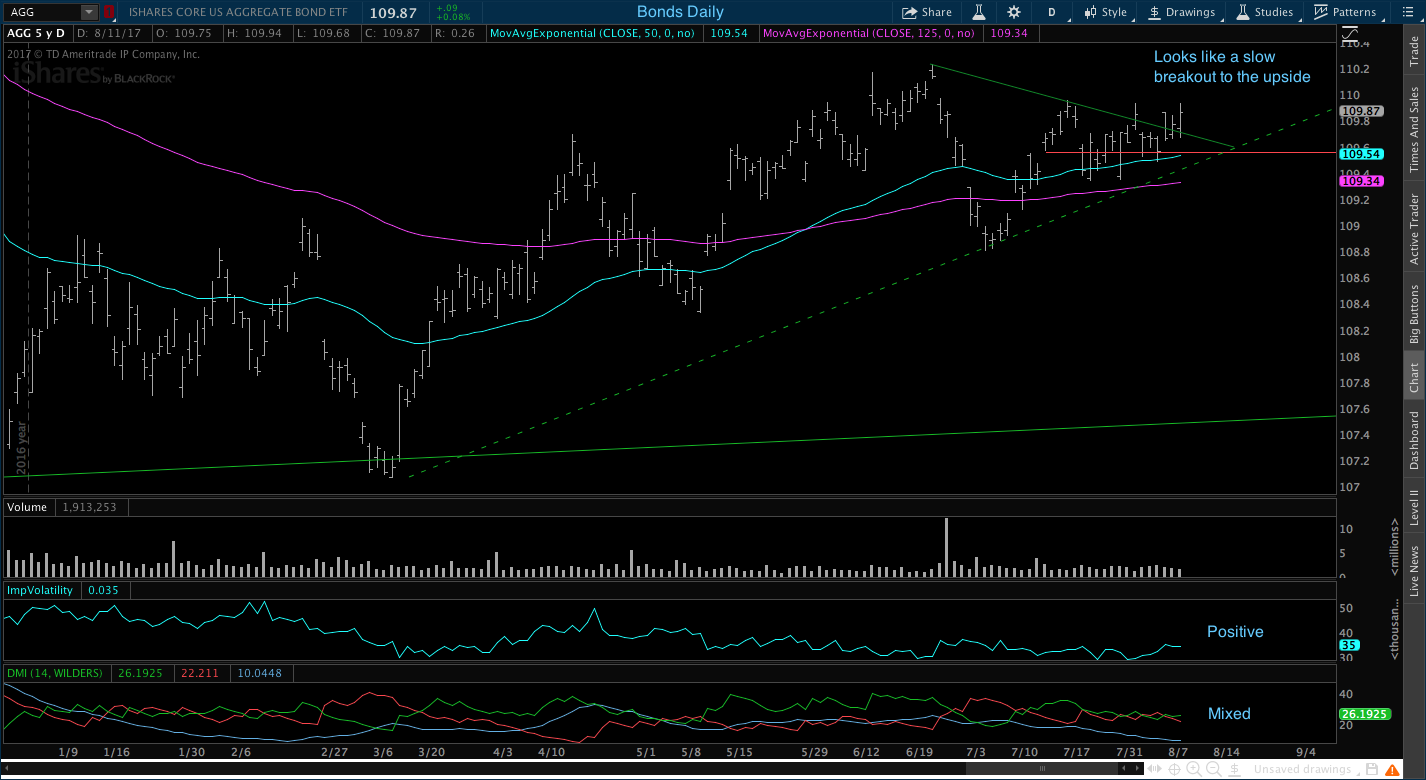
If I had followed the monthly move and bought into Bonds August 1st, I would have saved myself a little cash. Everytime I ignore the monthly moves and make decisions on my own, I lose. You would think at some point in time I would figure this out. But I am going to make a major claim here, I’m human. I am far from perfect but I do the best I can with the information that I have at the time when I make those decisions. For comparions, I would have had a 1.54% loss instead of a 1.74% loss if I would have 25% in all indexes, so not that big on the percentage side, but large in the dollar side. Bonds look like they are slowly but surely breaking out and moving like a snail uphil. DMI is still mixed and volatility is low. If you are in Bonds, ride it.


Conclusion: No way or knowing for sure if this is going to be a long term pull back but I suggest letting it ride until the end of August. If today was the end the month, all 4 indexes would still be a buy.
No comments:
Post a Comment