Wow, what a week for our TSP indexes. I haven’t been able to make any new deposit in my account since July 18th because of retirement. My account has reached an all time high as of Friday the 15th. It has been an incrediable run since March of 2016 and eventually this party will end, but I’m riding till the monthlys tell me to bail.
Retirement news: CSA site has entered it’s final phase on my pay after 78 days. I got an email this week stating this.
Assigned to Specialist:Your retirement application has been assigned to an OPM retirement specialist for calculation of your annuity benefit.
So I can only hope that by October 1st or November 1st, I will finally know what my final monthly paycheck will be. I know since my retirement date, or a bit before, that I have been going in about 10 different directions with family, friends, and life. My guardian angel must have been sitting on my shoulder, guiding me, and showing me the right path because, I’ve had a few people show me their hand, and storm clouds have parted, so that I can finally see my way out. Thank goodness for voices.
Let’s look at those charts.
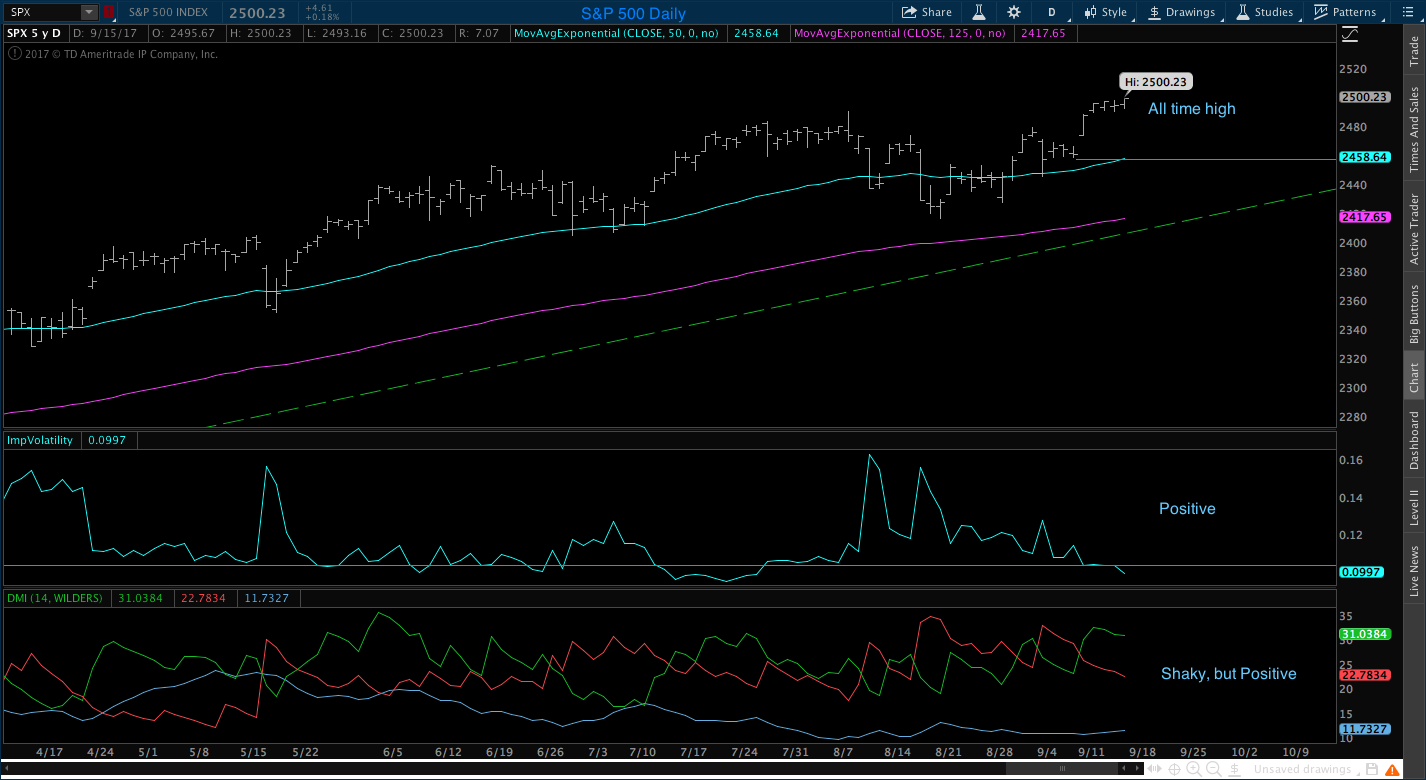
Last week I was very concerned that price was having a difficult time getting through the $2481 level. Monday, price rolled right up through that level and then climbed uphill the rest of the week. So now the S&P 500 is sitting at all time highs. Volatility is low, which is positive. The DMI turned positive this week but looks a little shaky. When the blue line gets above the red line, the DMI will look a lot better. Continuation higher next week will help validate the $2481 breakout.


The Small Cap last week looked grim to me. The pivot structure was screaming that we were heading lower. We needed price to reverse quickly before it reached the last pivot low at $1221. This week, we got it. So now we have a new short term trend based on 3 pivot lows. Basically a stair step climbing higher. Perfect structure which means in a week or two, price should be setting all time highs. DMI is also positive. Next week could be another good week for us if structure holds up.


The International did hold above that all critical $67.21 level. Volatility is low and positive. DMI is positive. So I see nothing but upside here for the International. The overall price struture is showing a very slow methodical climb higher. Worst case scenario here is to lose that $67.21 level. For now, all we do is watch and ride.


Bonds climb higher looks like it might be in trouble. It has been a couple of times in the recent past and always recovered the following week. This time however, the intermediate uptrend line has failed. Price close below that line Thursday and Friday. So we have the 1 sell warning, but we still need to more to be in trouble. The issue here is that the 50 day ma and the CBL is only pennies away. A close below both those levels and we have a daily sell. Volatility is still positive. The DMI is negative. Bonds are on watch.


Conclusion: Let’s keep riding our setup higher until the monthly tells us to bail out. Half way through september and and all the monthly levels look good except Bonds. They are being threatened.
No comments:
Post a Comment