You all know that I retired officially June 30th. I spent over half my life in that place and I really didn’t expect anything from Government. I always told people we are just a number and a warm body and once they are down with you, poof forgotten. So take care of yourself and family. So when this showed up in the mail this week, I was surprised.
Ok, I’ll admit, that’s pretty cool and I will hang it up on the wall somewhere. I also got notification from OPM about the transition from employed to retired. I and you eventually will be given a new webiste and CSA number to access your 1099r, address changes, and your annuity stuff. So I’ve been out for almost 1 month and things seem to be moving along nicely. Not sure if I will get a pay check August 1st or not. But I do expect by September 1st, that I will at least start receiving interim checks.
Let’s move onto the charts.
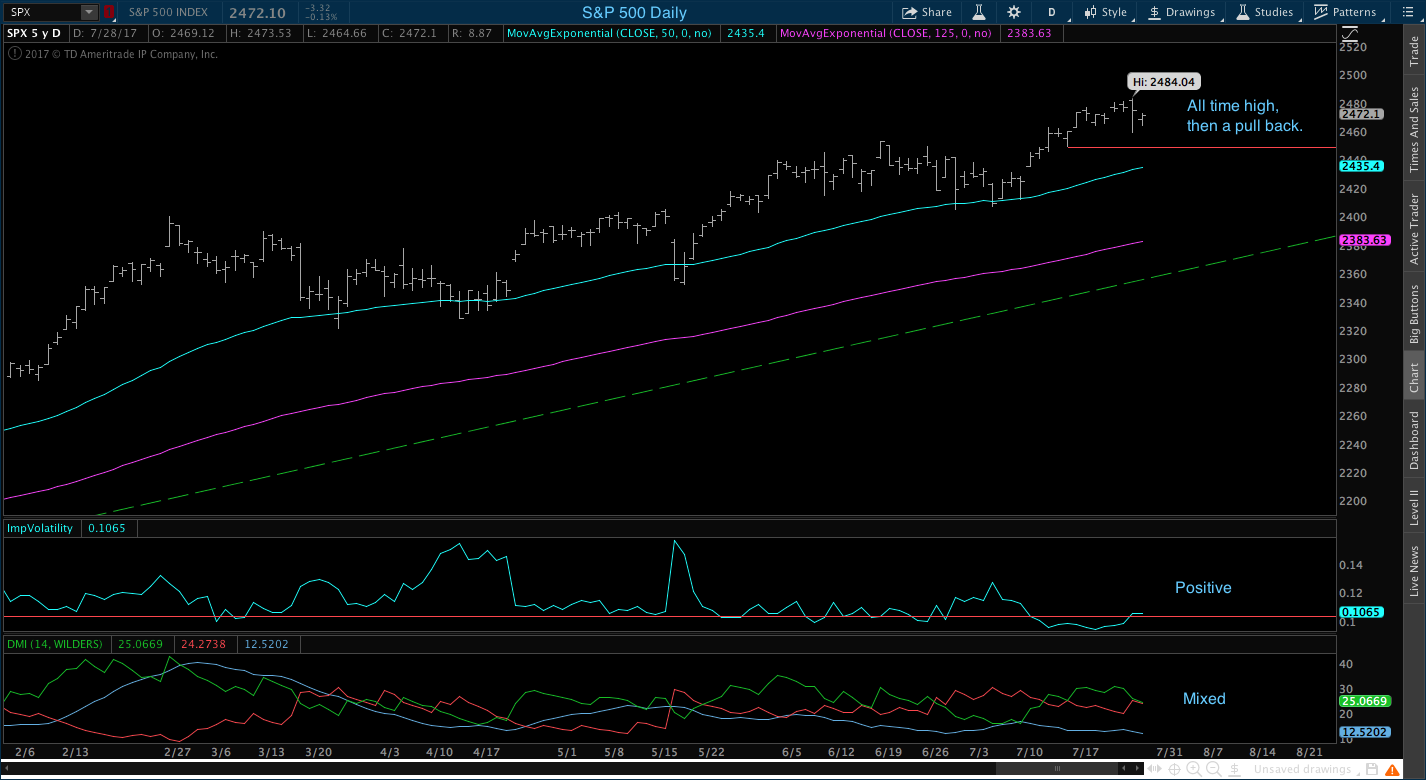
The S&P 500 did hit an all time closing high Wednesday and an all time high Thursday. Friday we gave some of that back. Volatility is still positive. The DMI is mixed and it might be warning a pull back soon. Right the S&P 500 is still on cruise control.


The Small Cap made an all closing and all time high on Tuesday. The next three days it gave it all back plus a little more. The DMI appears to be getting ready to flip negative. Everything else here is on cruise control.


The International index once again rose to the overhead resistance level of $67.21 and pull back. The break out was two weeks ago and we have a target of $71.39 and we are still waiting for that march higher in price. Volatitiy is positive. DMI is positive. So one would think next week we should break through that resistance level. The more times we hit resistance and fail, the more likely the bill flag breakout and target will fail.


Bonds daily chart is all over the place. Tuesday a sell signal only to be canceled Wednesday. Thursday a sell warning only to be canceled Friday. Volatility and DMI are positive. May 2017 Bonds were a buy. June 2017 they were a sell. July??? I have a feeling that Bonds will barely be a buy come the end of July. I also have a feeling that I will not make that move because of all the back and forth on all the daily and monthly charts. The weekly charts rarely if ever get things right, but I am going to have a to take a closely look at using the weekly charts for making moves with bonds. The last few years it’s been almost spot on. It may have to do with the slow movement.


Conclusion: Next Monday is the end of the month and I will get out those monthly moves as soon as possible Monday night. I do not expect any changes going into August except for bonds.
No comments:
Post a Comment